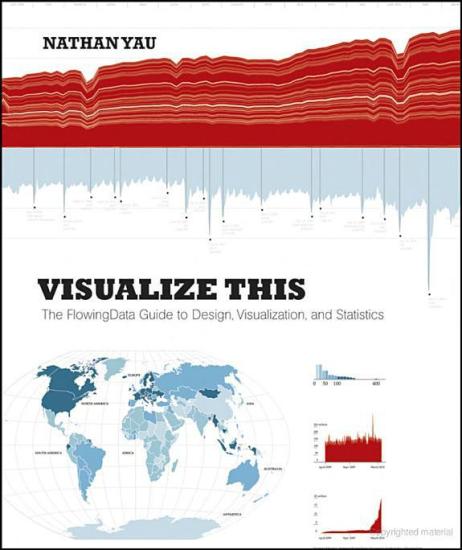
Summary:
See your data in new ways
Our world is awash in data. To mean anything, it must be
presented in a way that enables us to interpret, analyze, and
apply the information. One of the best ways to do that is
visually. Nathan Yau is a pioneer of this innovative approach. In
this book, he offers you dozens of ideas for telling your
story with data presented in creative, visual ways. Open the
book, open your mind, and discover an almost endless variety
of ways to give your data new dimensions. Learn to present data with visual representations that
allow your audience to see the unexpected Find the stories your data can tell Explore different data sources and determine effective
formats for presentation Experiment with and compare different visualization
tools Look for trends and patterns in your data and select
appropriate ways to chart them Establish clear goals to guide your visualizations Visit the companion web site at
www.wiley.com/go/visualizethis for code samples, data files
you can download, and interactive examples to show you how
visualization works
Nathan Yau is a PhD candidate in Statistics
at UCLA and a lifelong data junkie. His goal is to make data
available and useful to those who aren't necessarily data
experts, and he focuses on data visualization and personal
data collection. You can follow his visualization experiments
at http://flowingdata.com.From the Back Cover
About the Author